Focus on the city
What does ‘city’ mean today? How will cities develop in the future and what is my own city of dreams? These questions are the focus of the third edition of the Zukunftsalmanach [Future Almanac] from the Futurzwei Stiftung [Futurzwei Foundation], which brings together over 50 stories of successful alternatives to the pursuit of unrestrained growth.
–
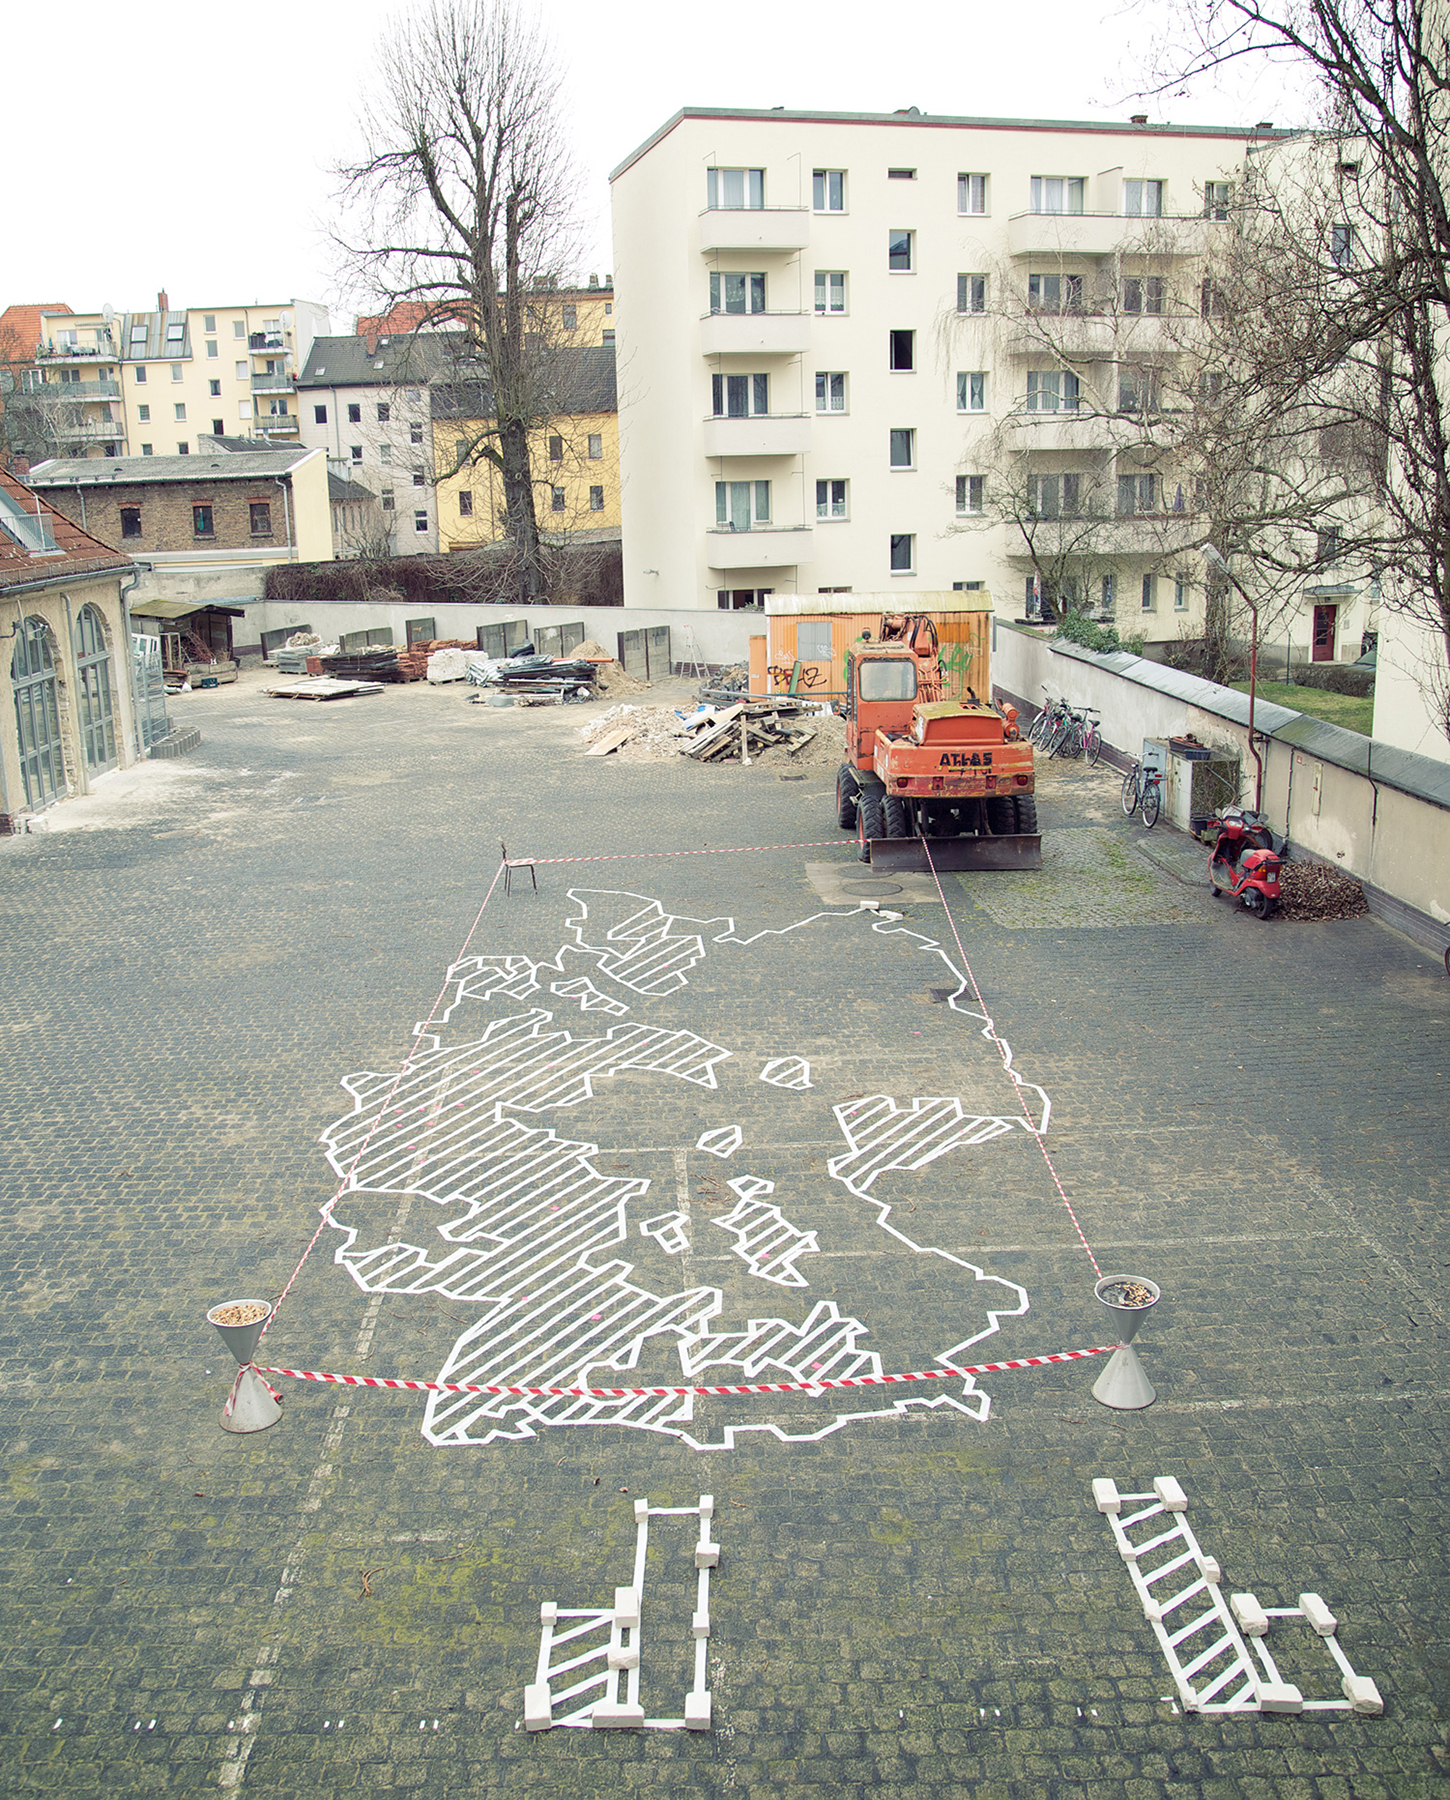
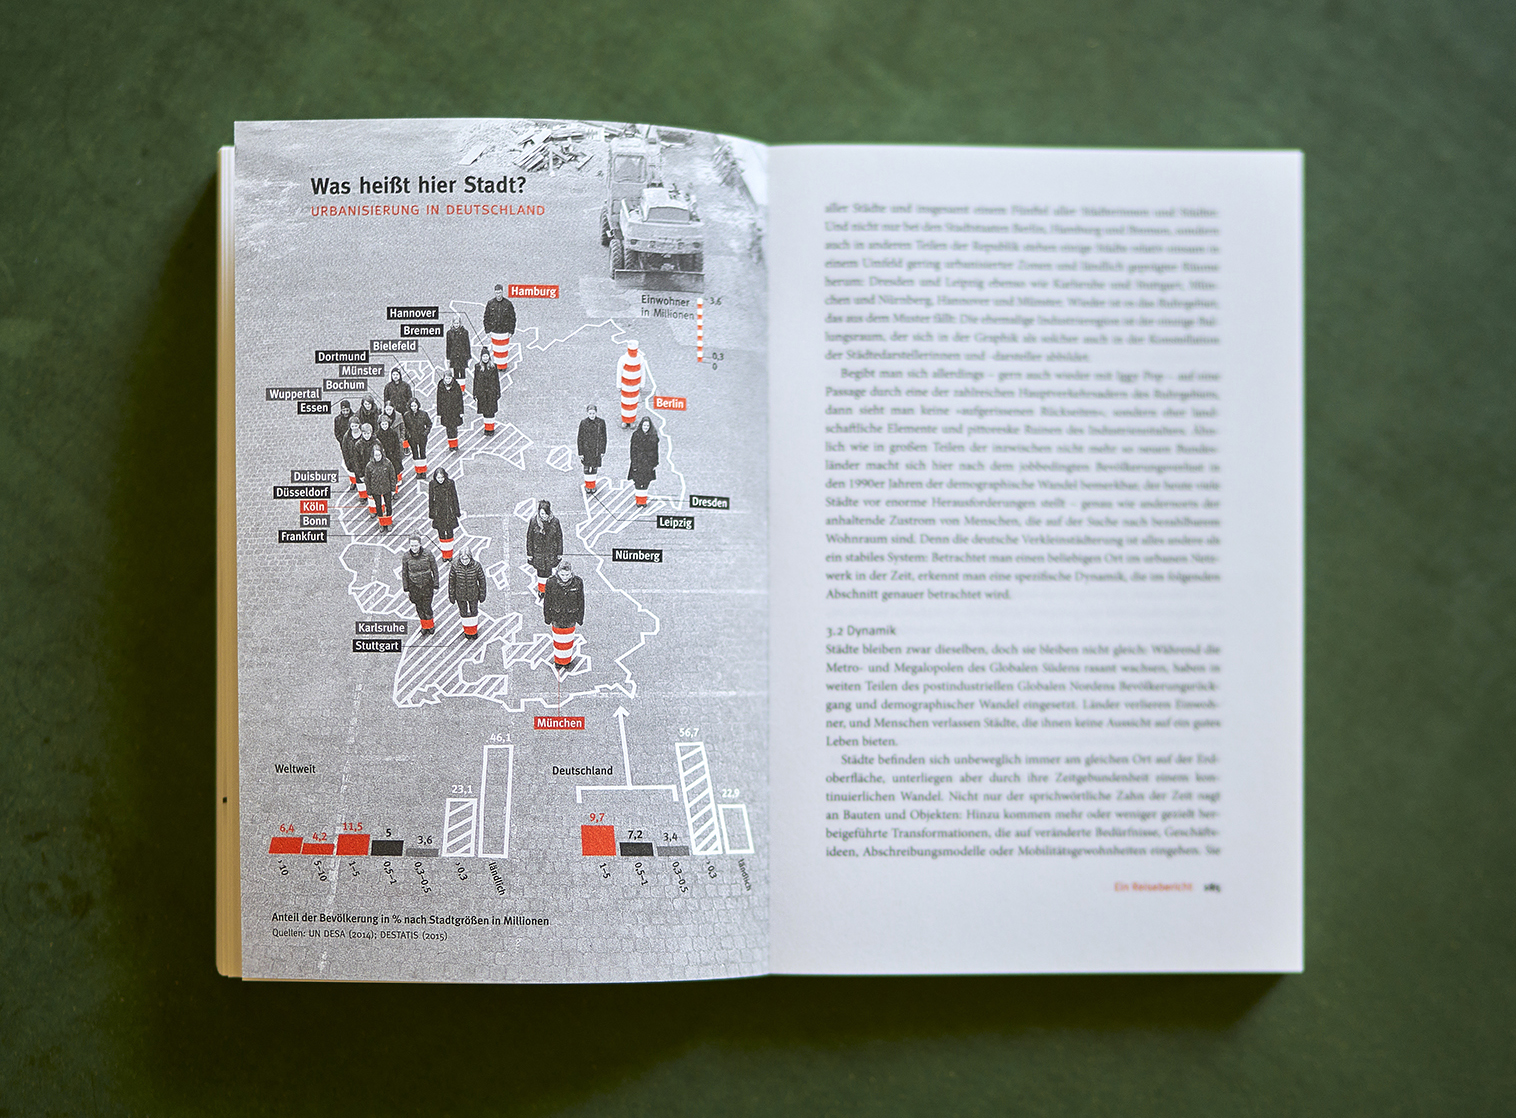
What does city refer to here?
Urbanisation in Germany.
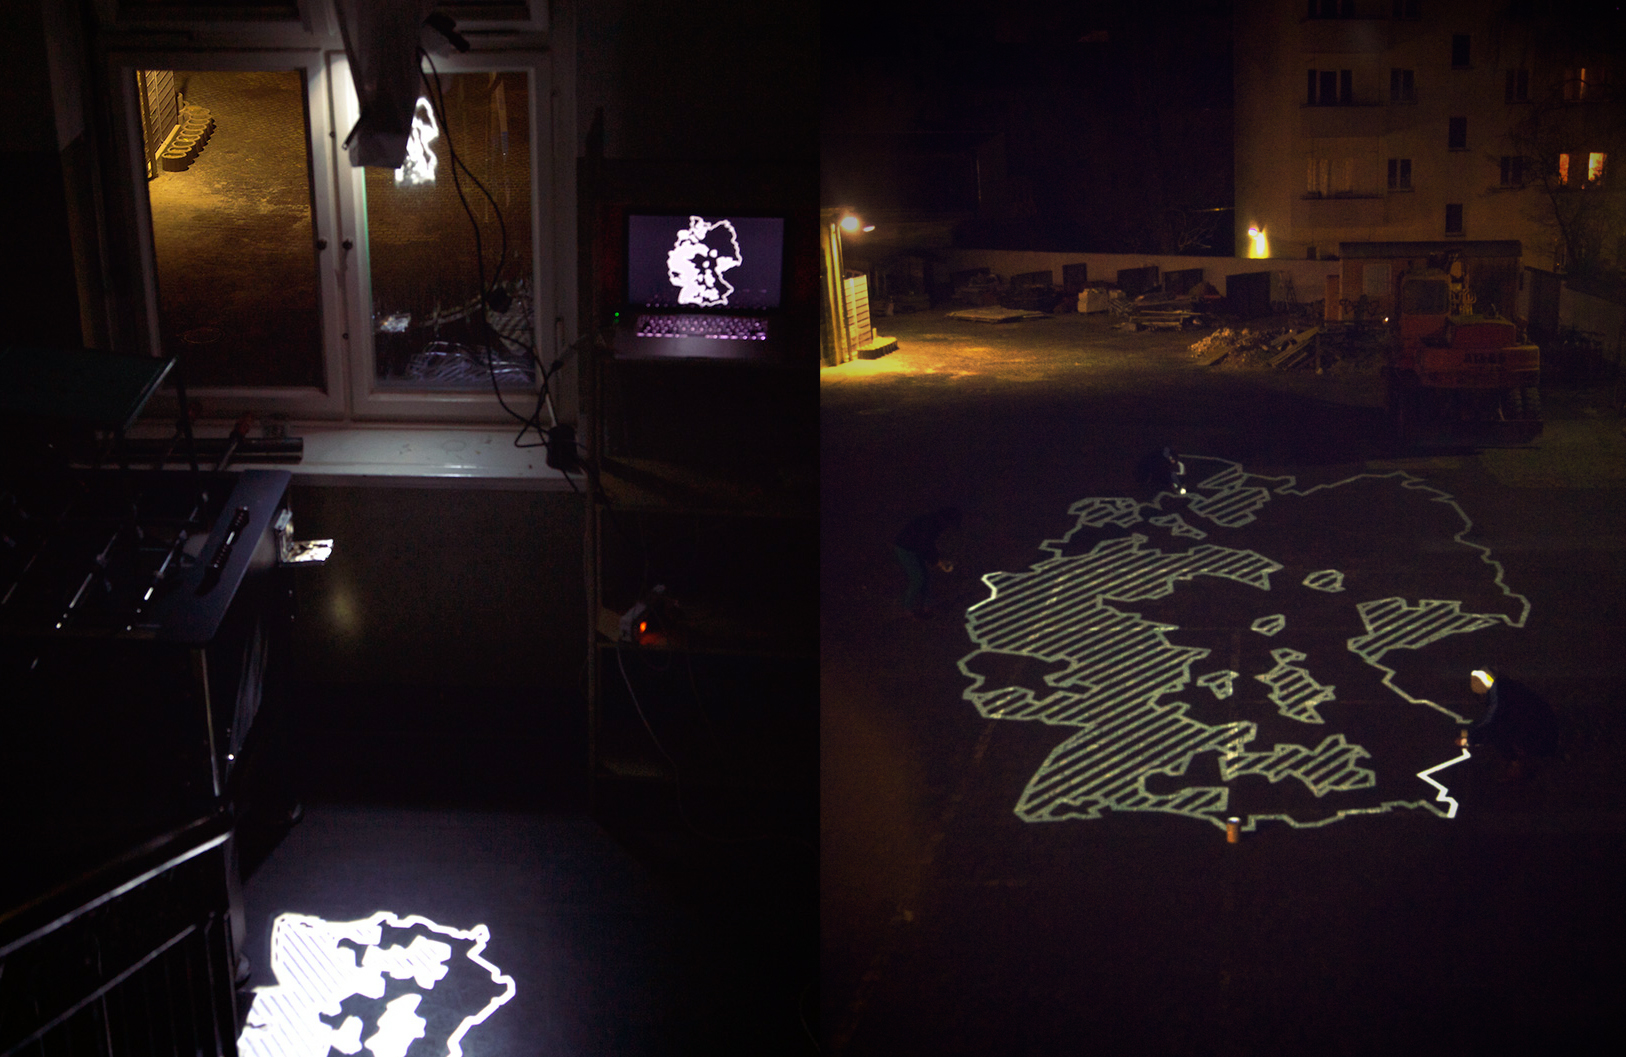
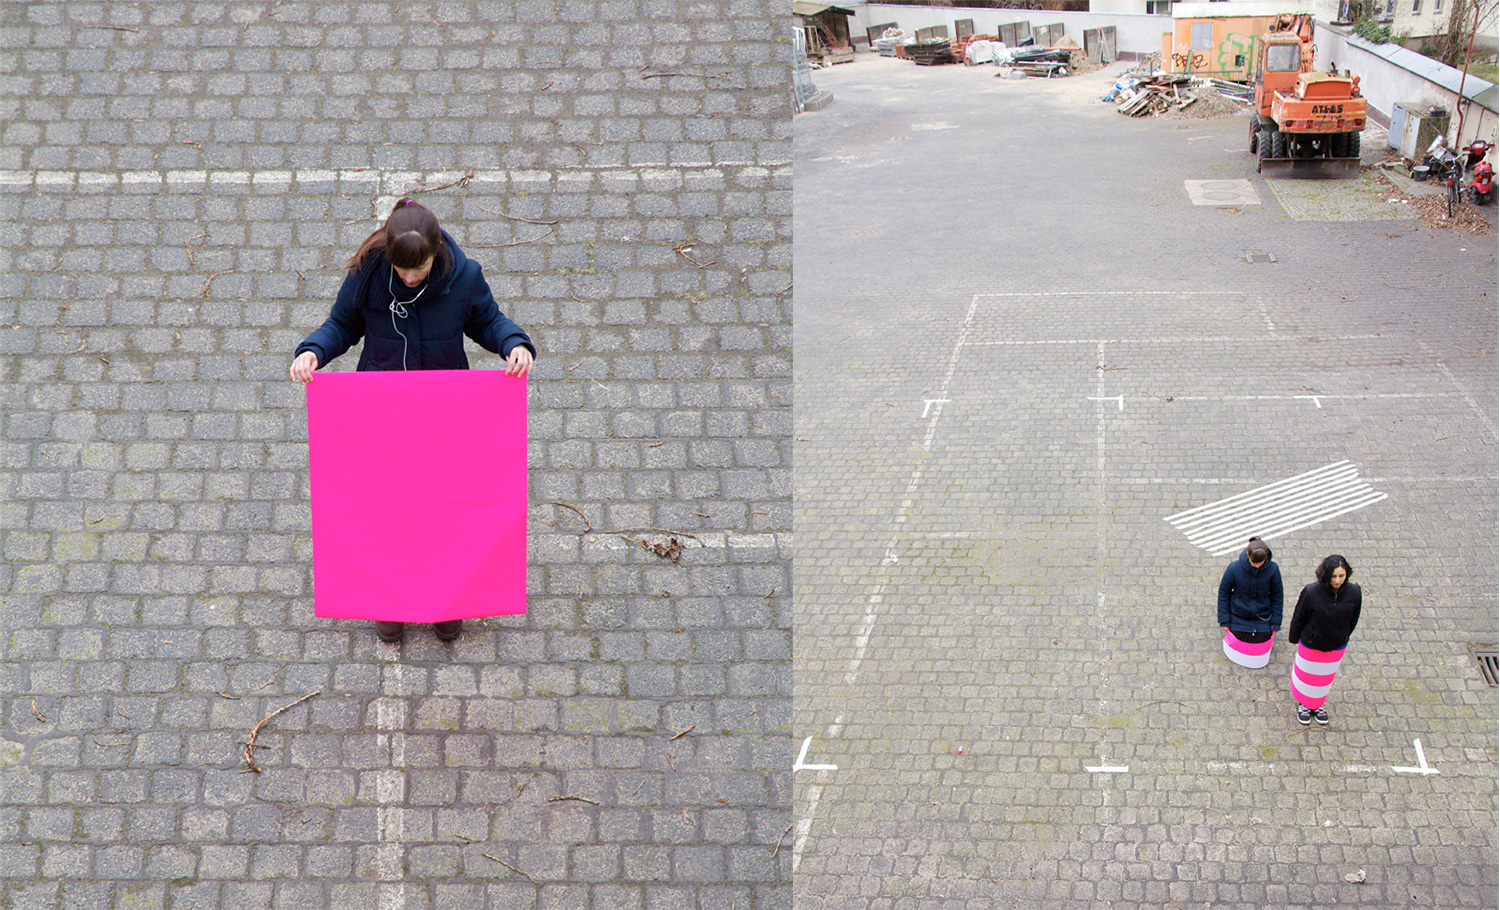
Reflecting the focus of the book, La Loma represented data in urban space and through the people who live in the city: for the map of Germany, 21 actors, representing the cities in which one fifth of Germans live, where photographed on a drawn out map in a Berlin backyard.
The visualisations of the almanac thus capture the lively momentum of the city with its uncontrollable factors such as passing pedestrians and the unpredictable weather.
–
Living space as commodity
Income and housing cost development 2009 until 2014.
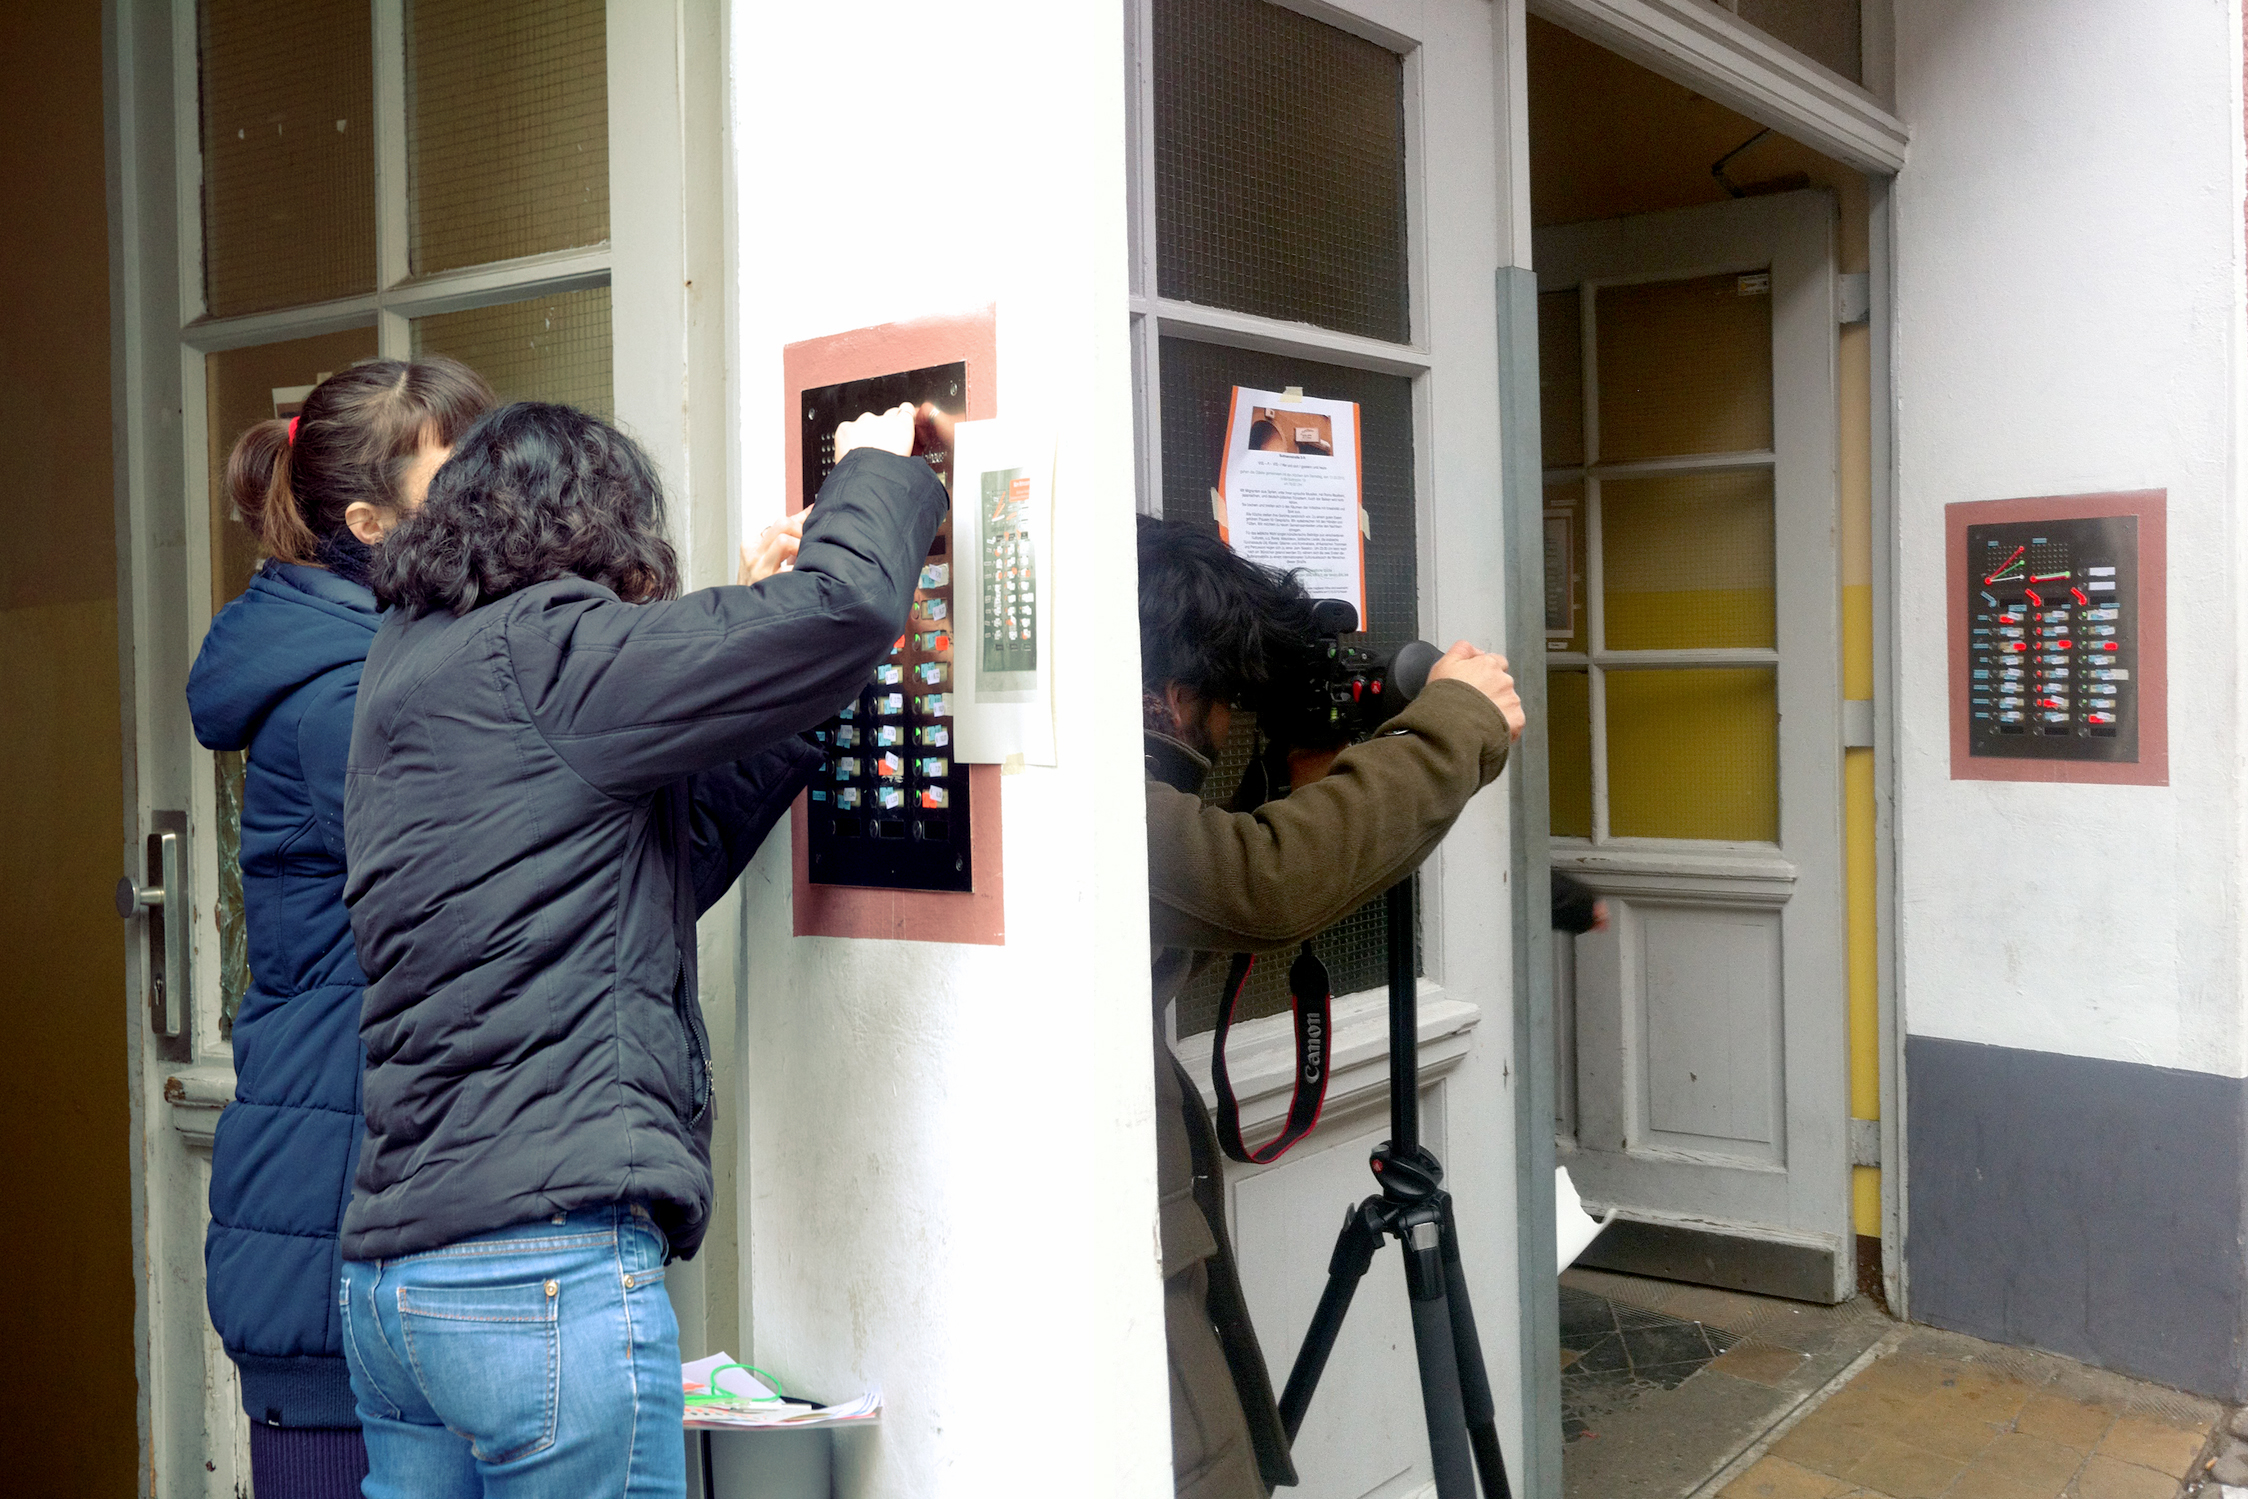
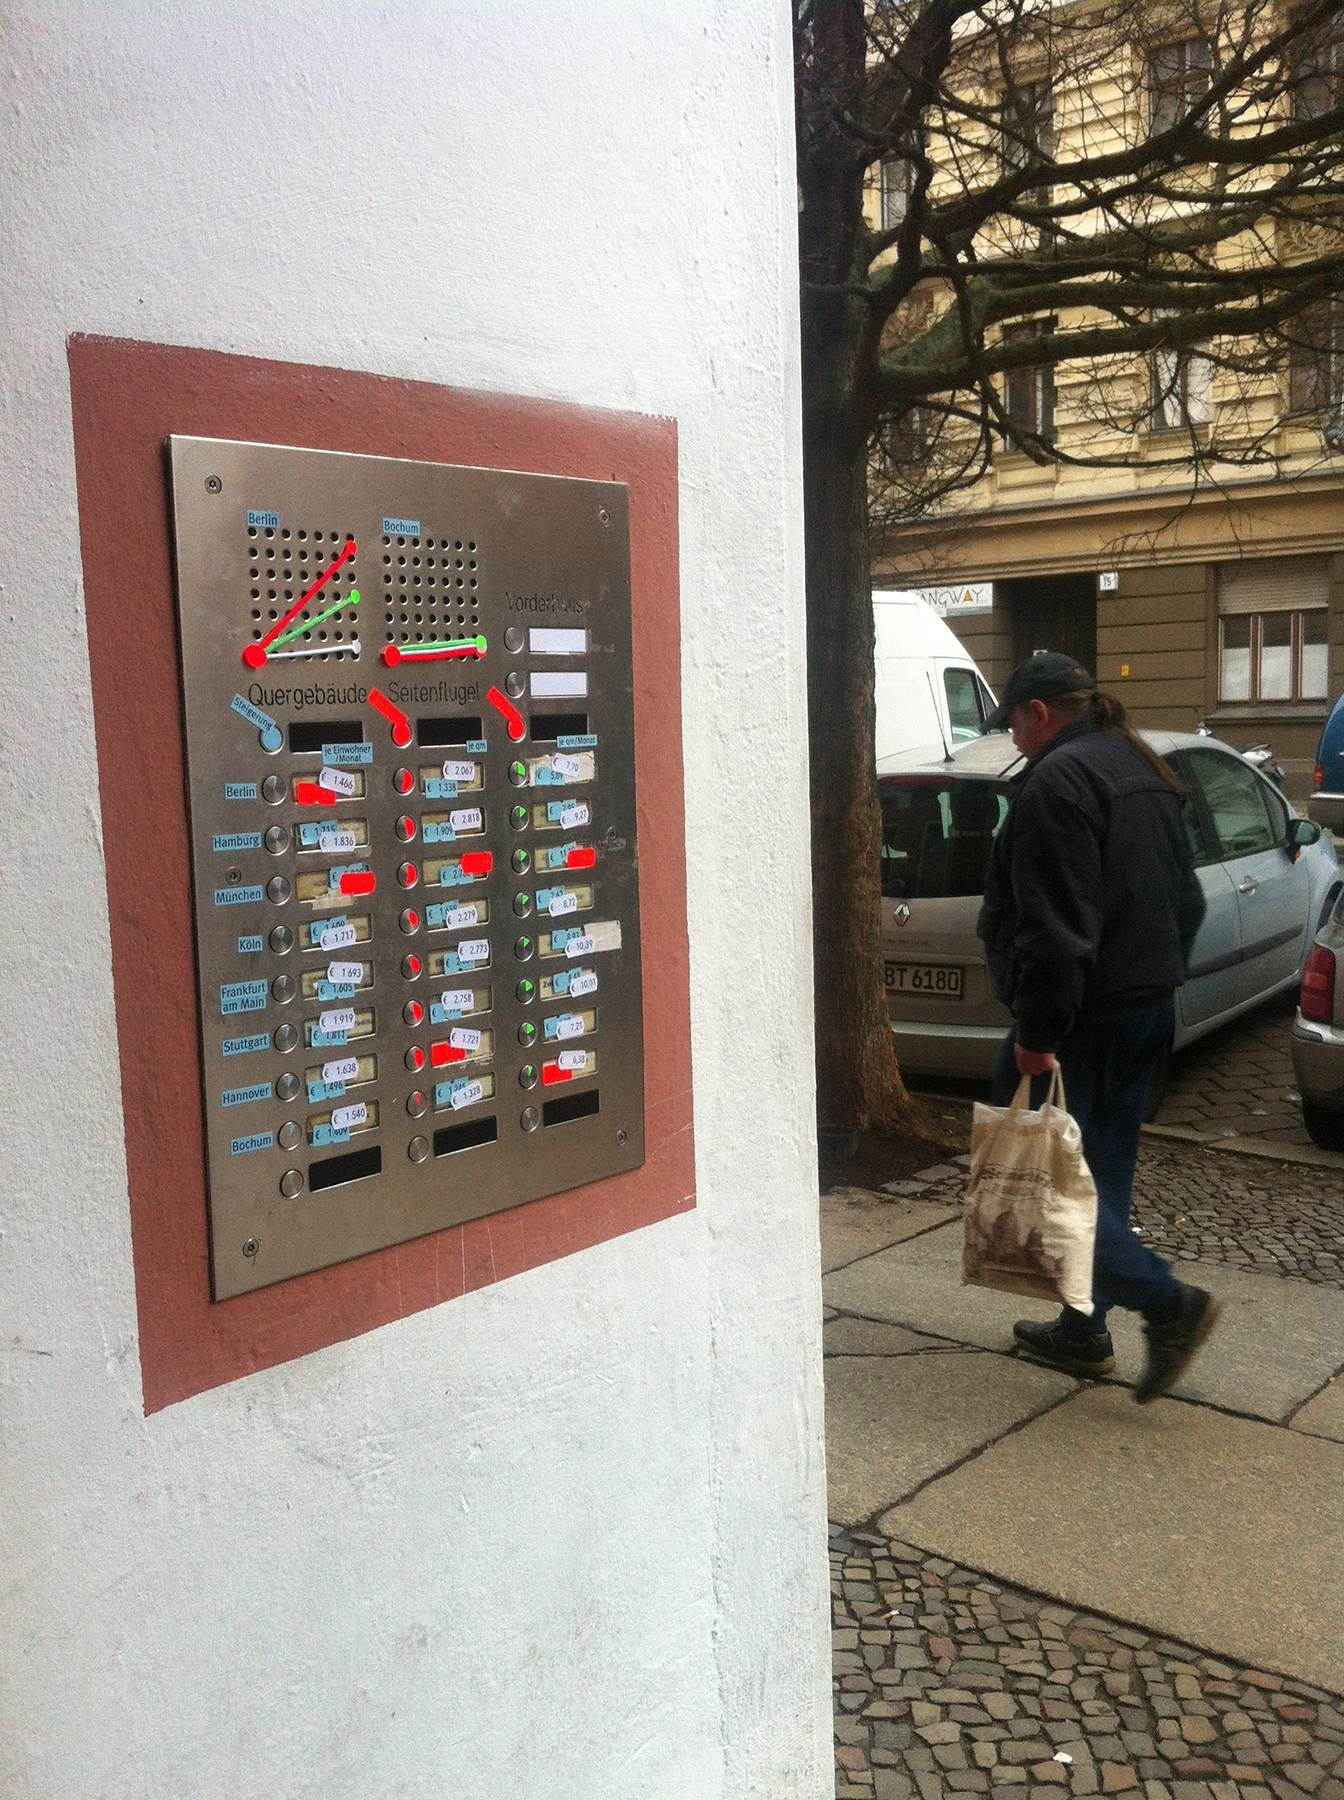
Living space is an expensive commodity – this is pointed out by the doorbell panel on which names have been replaced by price tags. It serves as an information carrier for a graphic whose three columns reflect the development of per capita income, the price of condominiums and the cost of new rentals from 2009 to 2013/14.
The comparison of Berlin and Bochum in the speaker’s area shows two extremes: in Berlin, the costs for owner-occupied and rented flats rose sharply – unlike the average income. In Bochum, on the other hand, all three develop in parallel. The pie charts on the doorbell buttons illustrate the percentage rate of increase.
–
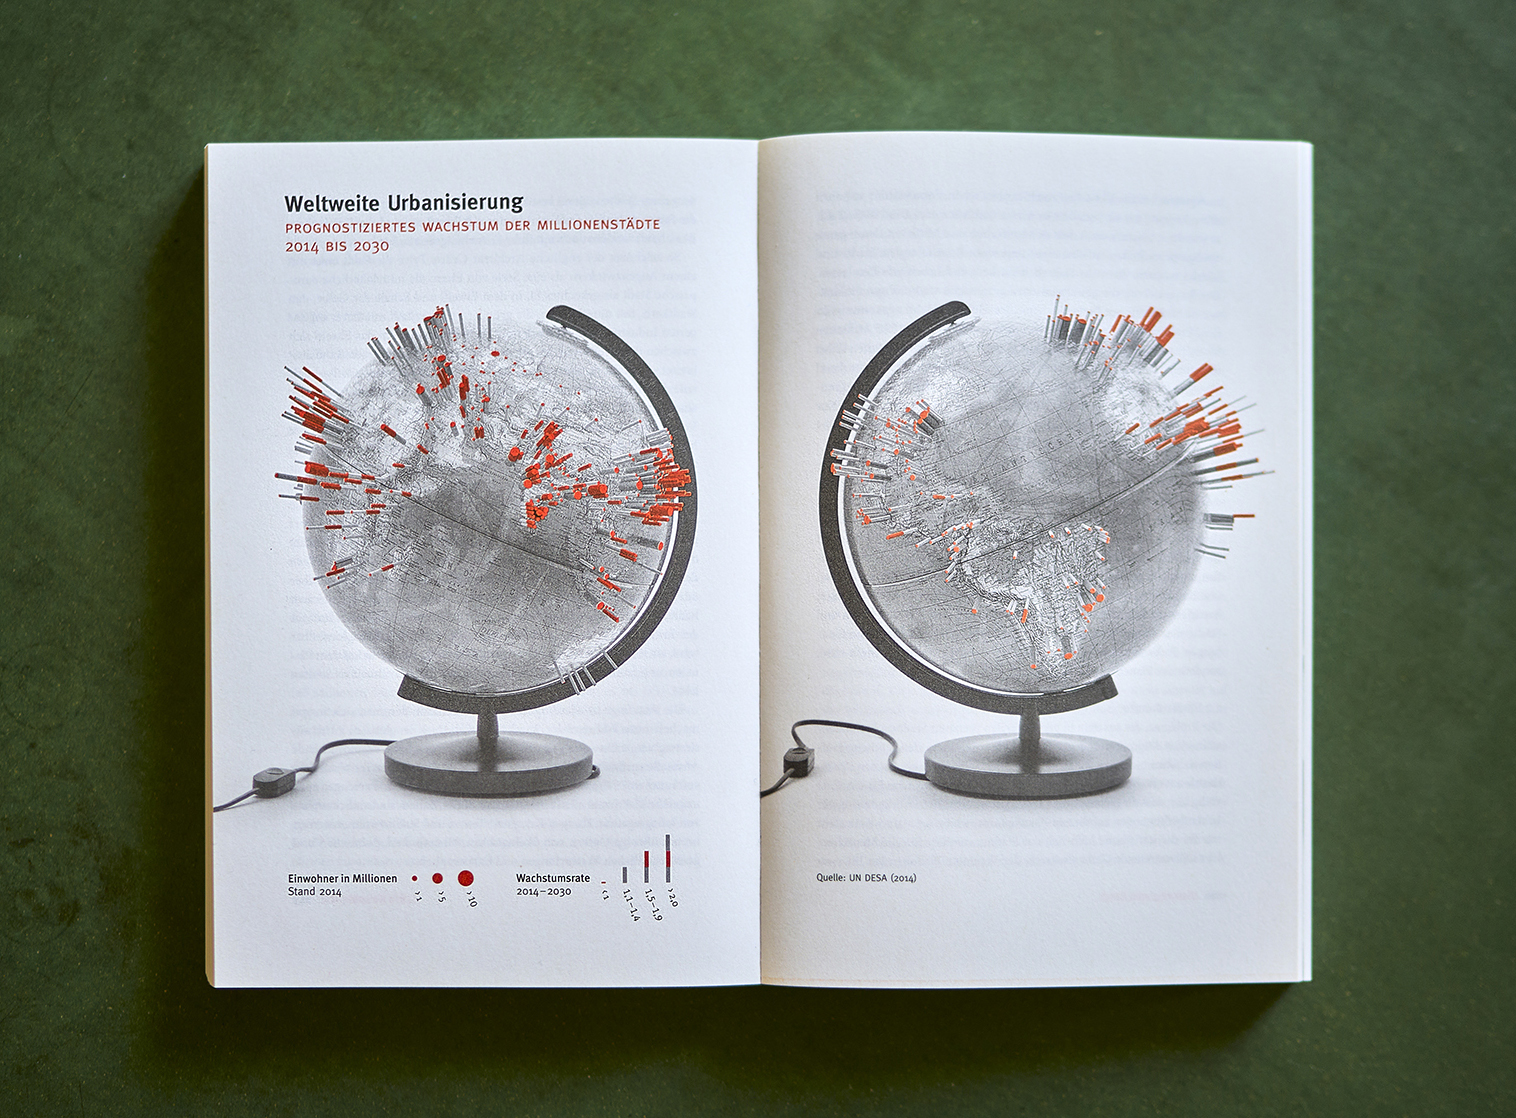
Global urbanisation
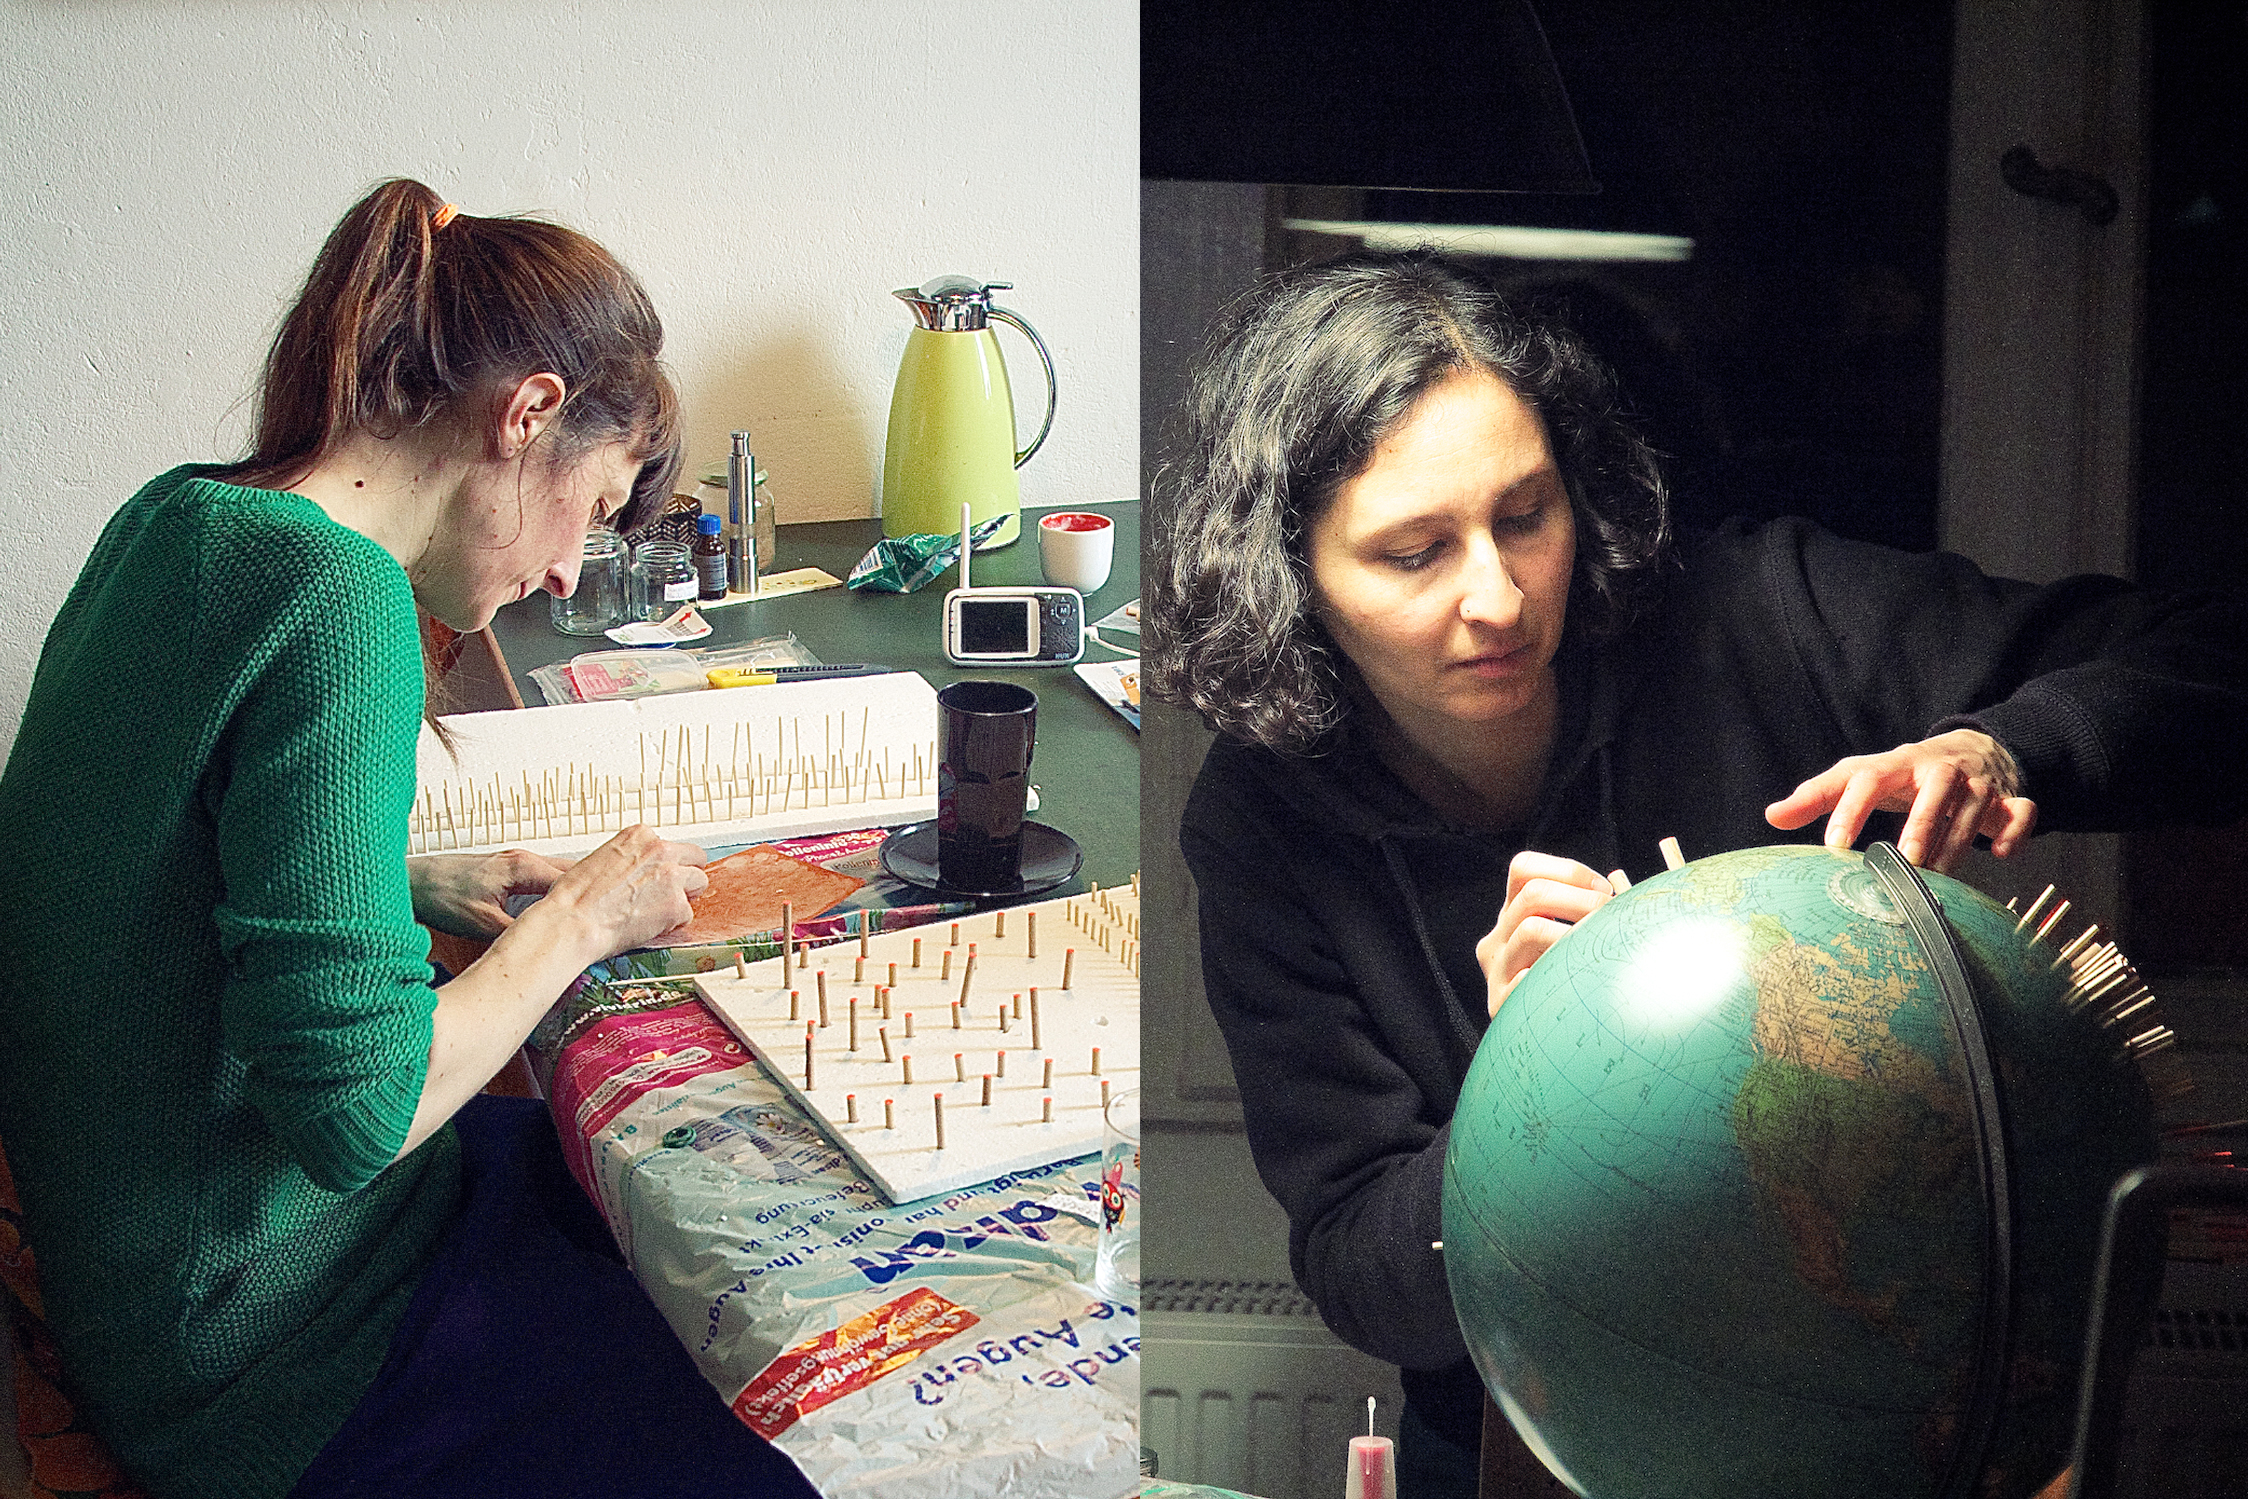
Projected growth of megacities 2014 to 2030.
The so-called ‘Global North’ will play a marginal role in the population development of the coming years. The data transferred by La Loma to a standing globe illustrates the enormous growth for cities in the ‘Global South’ by 2030. For this, 488 cities with over a million inhabitants were located on the globe with the help of a digital map and marked with wooden sticks according to their current size and projected growth.