The Glass Room Berlin
It is barely foreseeable what happens to the data that is collected during the use of Google products and passed on to its parent company Alphabet Inc..
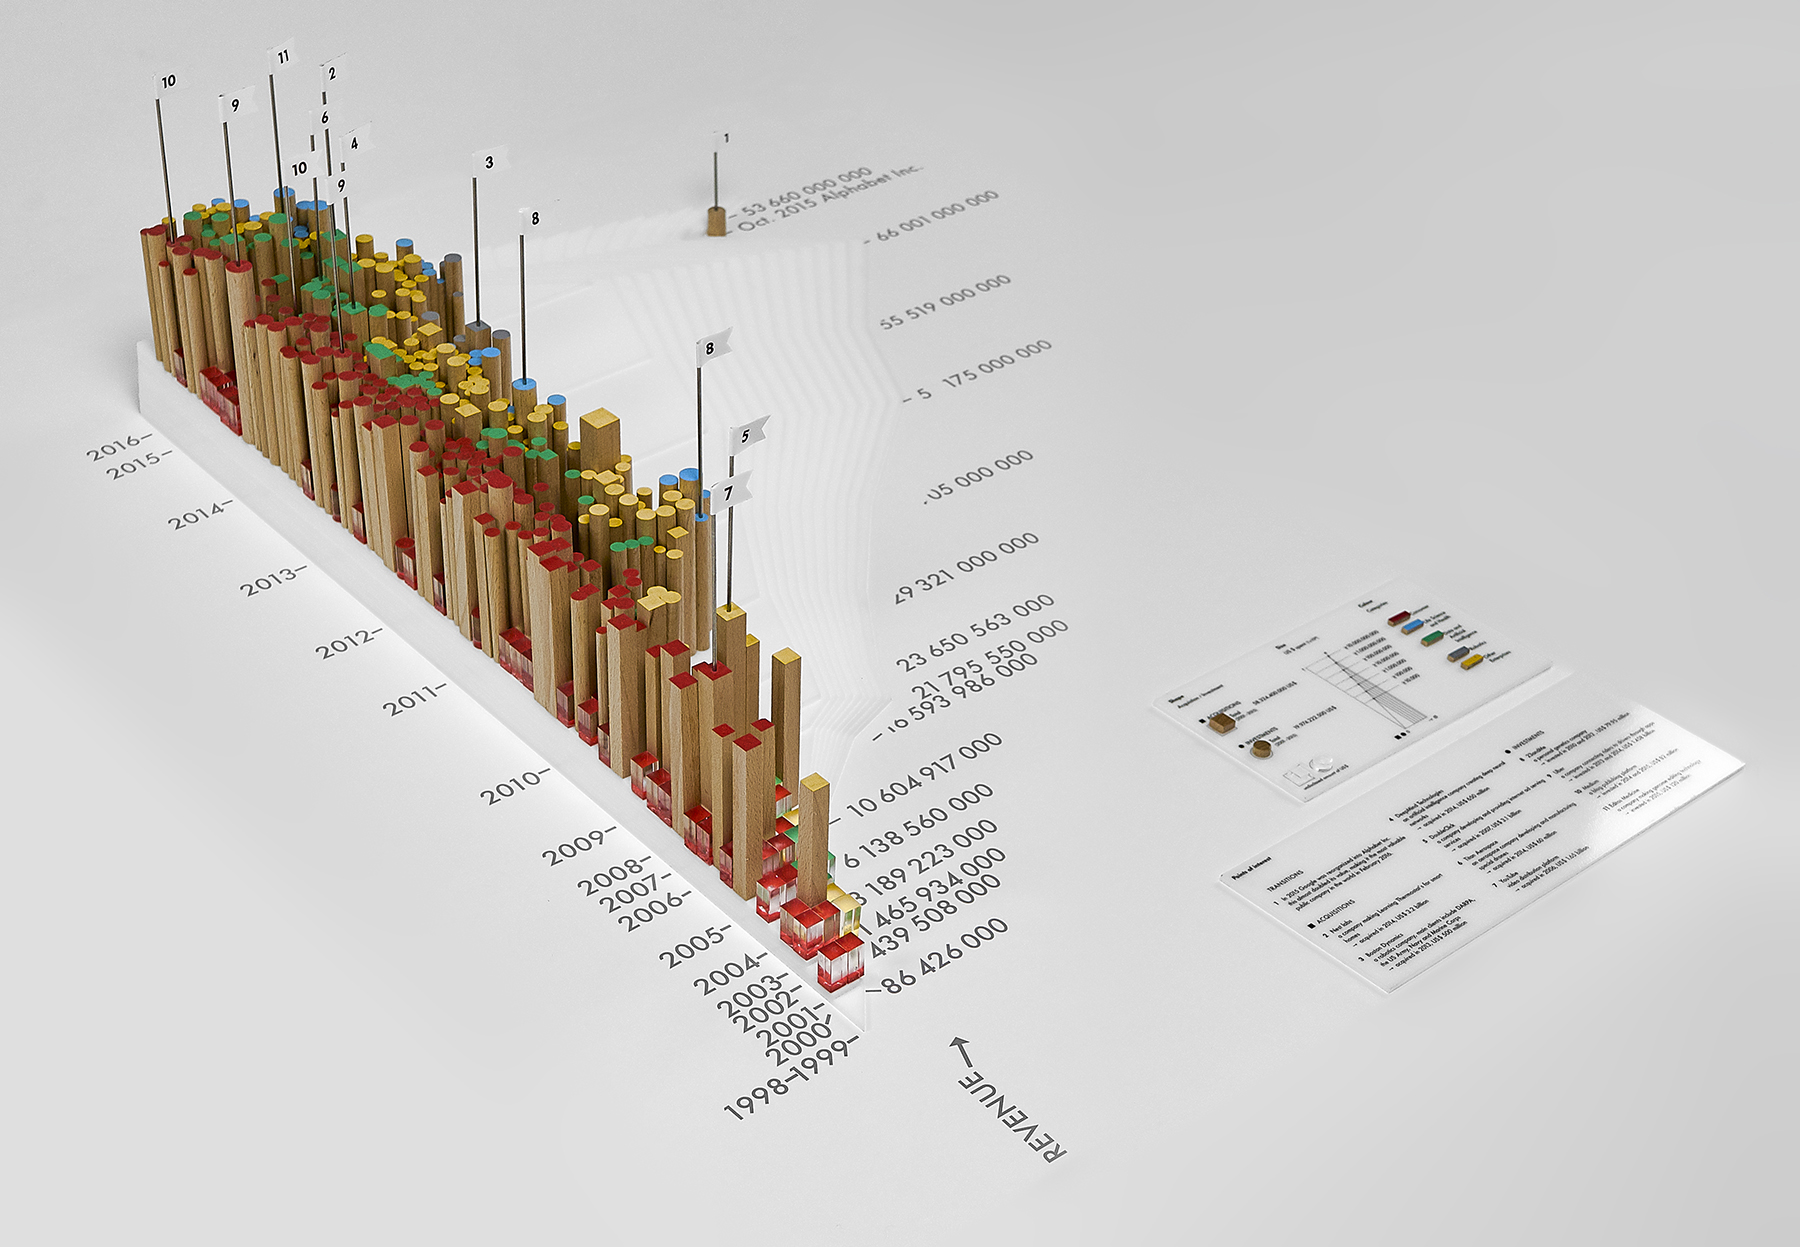
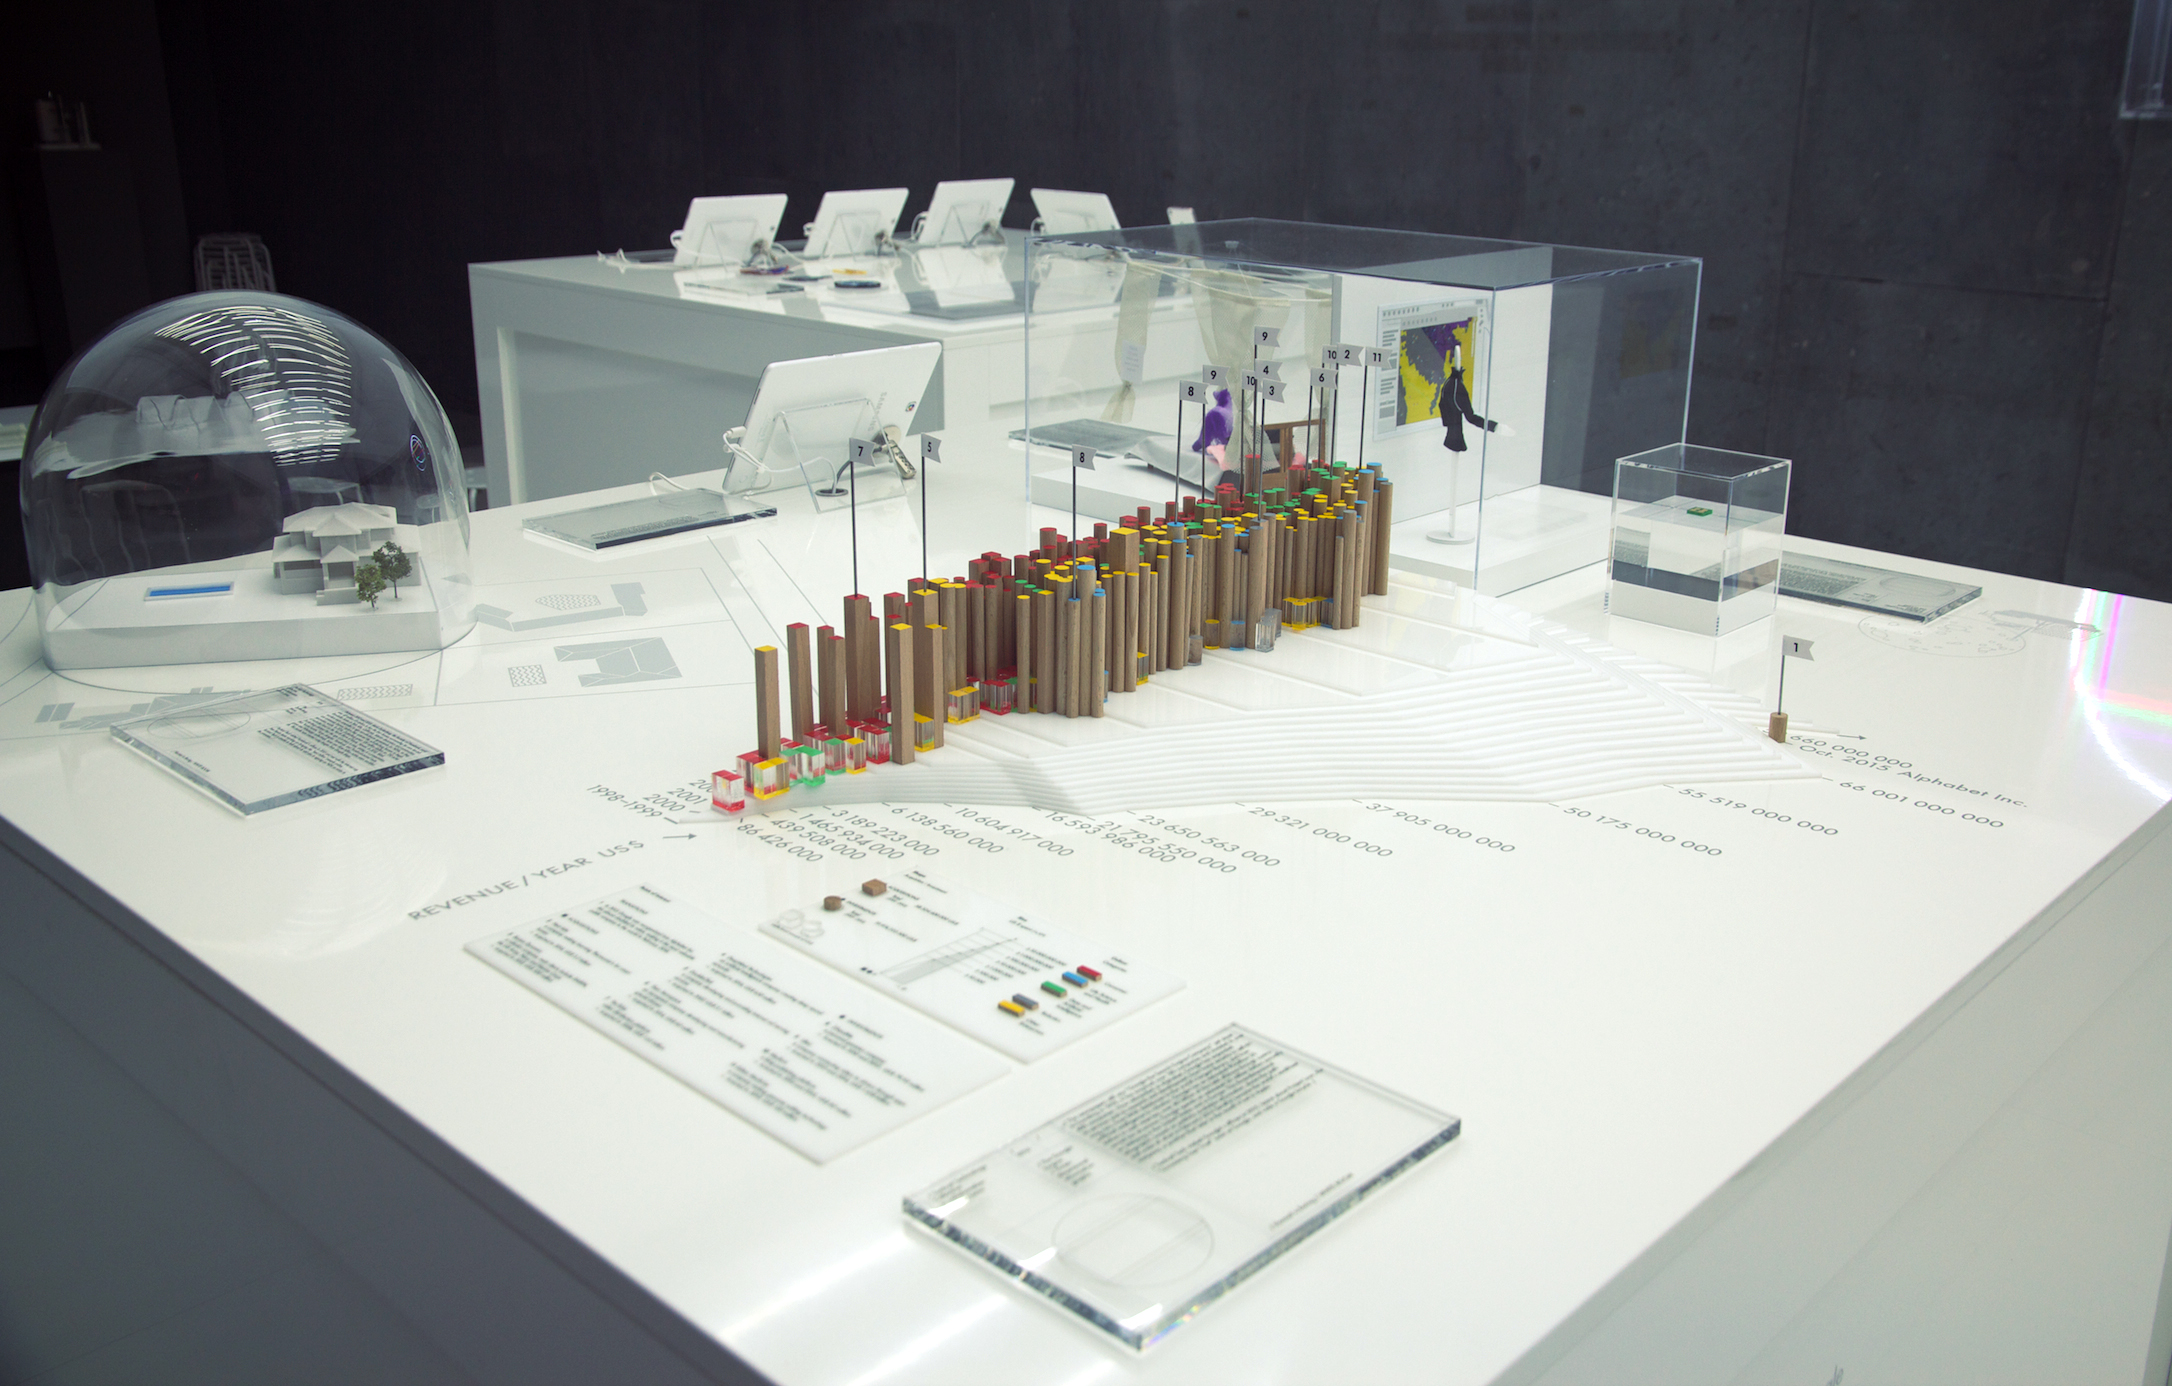
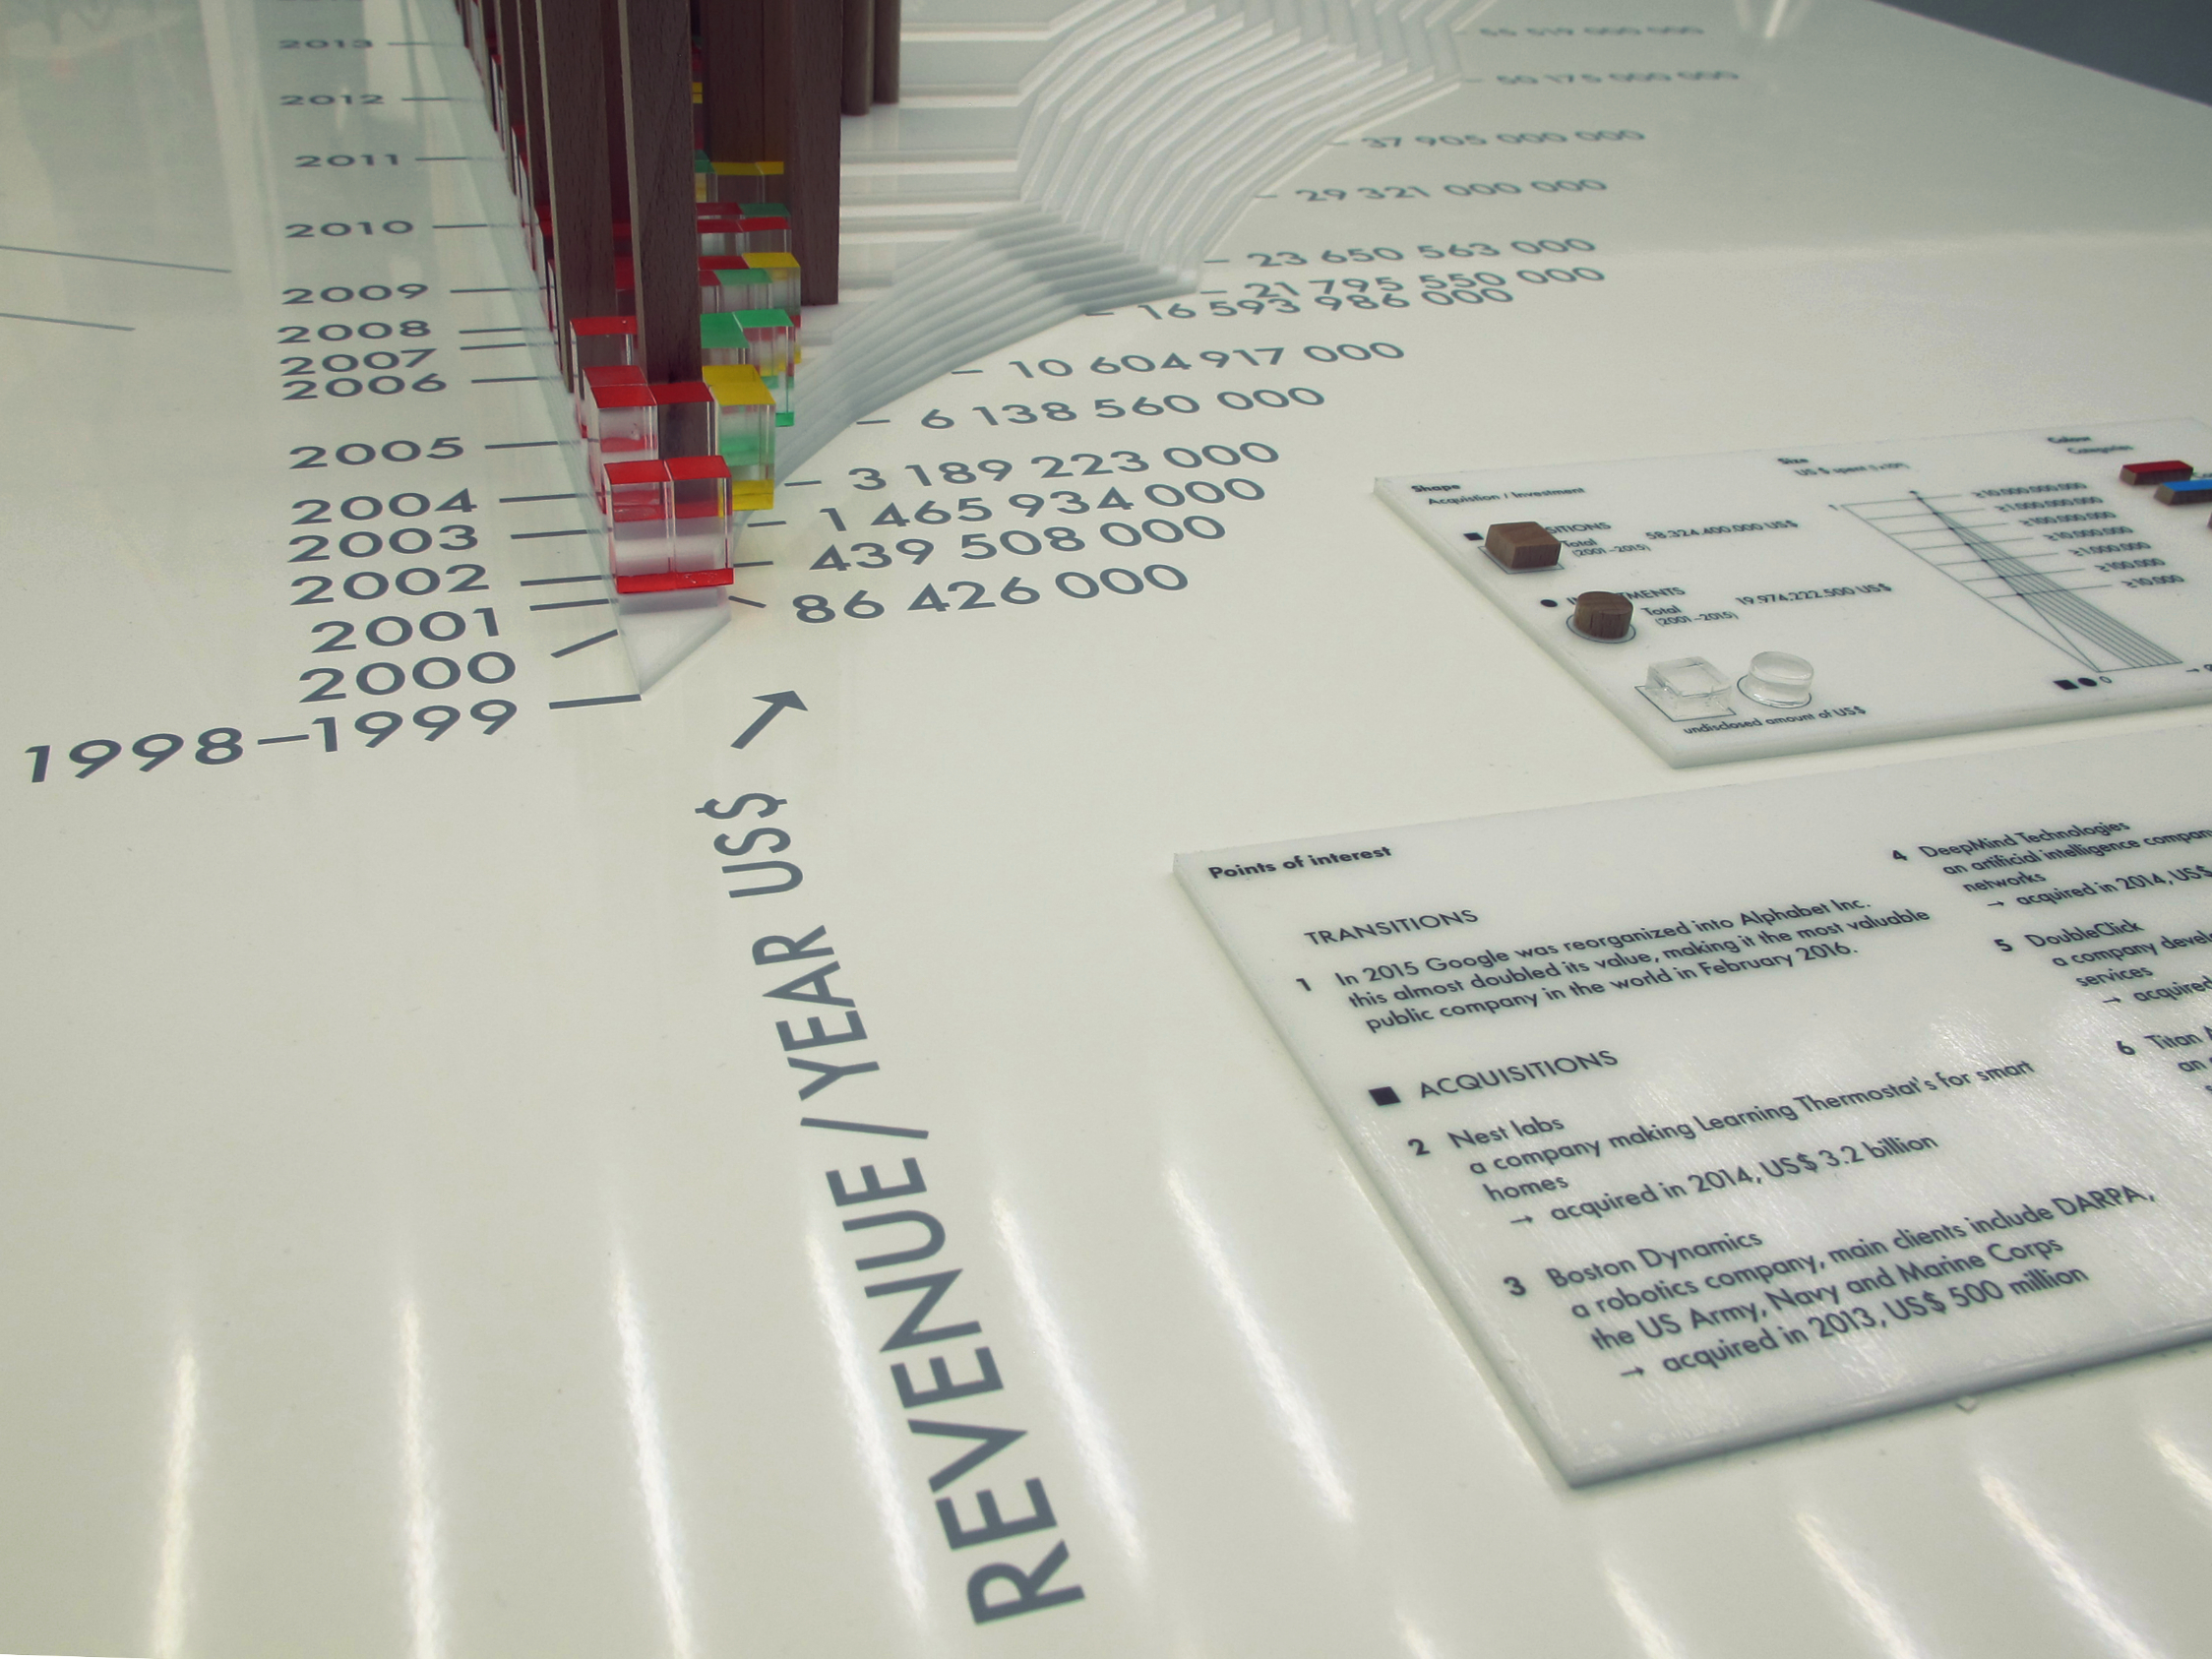
“The Google Empire” translates the incalculable amount of abstract information about Google’s widespread interests and entanglements into a three-dimensional infographic. An area diagram of the growing revenue serves as the basis on which numerous 3D bars are shown. These are coloured and shaped in such a way that they reflect all the investments and acquisitions since the company was founded from 1998 to 2016. Significant expenditures are marked with a flag and are detailed in the legend.
This presentation of the data not only reveals the company’s focus areas such as health, artificial intelligence and robotics, it also visualises the company’s potential influence on many areas of our everyday lives.